SWRO vs BWRO: Choosing the Right Membrane for Your Application
Not all RO membranes are equal. The two dominant categories, seawater reverse osmosis (SWRO) and brackish water reverse osmosis (BWRO) are engineered for fundamentally different feedwater salinities and operating pressures. Selecting the wrong membrane type leads to under-performance, accelerated fouling, or premature failure.
| Parameter |
SWRO Membrane |
BWRO Membrane |
| Feedwater TDS |
30,000–45,000 mg/L (open ocean) |
1,000–10,000 mg/L (brackish groundwater, estuaries) |
| Salt Rejection Rate |
> 99.5% (typically 99.6–99.8%) |
96–99.5% |
| Operating Pressure |
55–85 bar (800–1,230 psi) |
10–25 bar (145–365 psi) |
| Permeate Recovery |
35–50% |
70–85% |
| Energy Consumption |
3–6 kWh/m³ (with ERD) |
0.5–2.5 kWh/m³ |
| Typical Membrane Materials |
Thin-film composite (TFC) polyamide |
Thin-film composite (TFC) polyamide |
| Pressure Vessel Length |
1,016 mm (40 in) elements, 6–8 per vessel |
1,016 mm elements, 6–7 per vessel |
| Key Standards / Testing |
ASTM D4516 (SWRO), IDA performance benchmarks |
ASTM D4194 (BWRO) |
The > 99.5% salt rejection rate is a critical specification for SWRO systems supplying drinking water. A membrane operating at 99.5% rejection on 35,000 mg/L seawater produces a permeate of approximately 175 mg/L TDS — well within the WHO potable water guideline of 500 mg/L TDS.
For projects where feedwater salinity varies seasonally (e.g., coastal intake near river deltas), a SWRO-rated membrane operated at reduced pressure can handle lower-salinity periods without replacement, offering operational flexibility that BWRO membranes cannot safely provide.
Energy Consumption in Seawater Desalination: RO, MED, and MSF Compared
Energy cost is the single largest operational expense in seawater desalination, often representing 30–50% of the total cost of water produced. The three main large-scale technologies Reverse Osmosis (RO), Multi-Effect Distillation (MED), and Multi-Stage Flash (MSF) differ substantially in their energy profiles.
| Technology |
Energy Type |
Typical Consumption |
Best-Case with Recovery |
Carbon Footprint |
| Reverse Osmosis (RO) |
Electrical (high-pressure pumping) |
3–6 kWh/m³ |
2–3 kWh/m³ (with ERD) |
Low – compatible with renewable energy |
| Multi-Effect Distillation (MED) |
Thermal (low-grade steam) + electrical |
5–9 kWh equivalent/m³ |
4–6 kWh eq/m³ |
Moderate – depends on heat source |
| Multi-Stage Flash (MSF) |
Thermal (steam) + electrical |
10–16 kWh equivalent/m³ |
8–12 kWh eq/m³ |
High – typically co-located with power plants |
Why RO Dominates New Installations
The global shift toward RO is primarily energy-driven. Energy recovery devices, particularly pressure exchangers (PX) have reduced SWRO energy consumption from over 8 kWh/m³ in the 1990s to below 3 kWh/m³ in the most efficient modern plants. The Sorek B plant in Israel, one of the world’s largest SWRO facilities, operates at approximately 2.7 kWh/m³.
Thermal processes (MED and MSF) remain competitive in regions where low-cost thermal energy is available, particularly Middle Eastern countries that co-generate power and water but they are increasingly uneconomical for greenfield projects globally.
Renewable Energy Integration
RO’s lower electrical demand and tolerance for variable input make it the only large-scale desalination technology currently compatible with intermittent renewable energy sources (solar PV, wind). Pilot projects in Chile, Australia, and Saudi Arabia have demonstrated off-grid solar-powered SWRO at commercial scale, pointing to a future where desalination becomes carbon-neutral.
RO Membrane Fouling in Seawater Systems: Types, Causes, and Prevention
Membrane fouling is the primary cause of RO system performance degradation. It increases differential pressure, reduces permeate flux, lowers salt rejection, and shortens membrane service life. Understanding fouling mechanisms is essential for any operator or engineer designing a seawater desalination system.
The Four Major Fouling Types
| Fouling Type |
Cause |
Indicators |
Prevention / Treatment |
| Particulate / Colloidal |
Suspended solids, clays, silt bypassing pre-treatment |
Rising differential pressure (ΔP) at lead elements |
Optimise pre-treatment; maintain SDI₁₅ < 3; 5 µm cartridge filters |
| Biological (Biofouling) |
Bacterial biofilm growth on membrane surface |
Rapid ΔP rise; membrane discoloration; biological odour in concentrate |
Continuous low-level chlorination (< 0.1 mg/L) upstream; periodic biocide dosing (DBNPA); CIP with alkaline detergent |
| Scaling (Inorganic) |
Carbonate, sulfate, silica precipitation at high recovery |
Salt rejection decline; concentrate pH rise; scale deposits visible on membrane autopsies |
Antiscalant dosing; acid dosing to control Langelier Saturation Index (LSI); limit system recovery to safe thresholds |
| Organic |
Humic substances, natural organic matter (NOM), hydrophobic organics |
Flux decline; permeate TOC increase |
Enhanced coagulation; activated carbon pre-filtration; NaOCl CIP |
Cleaning-in-Place (CIP) Protocol
When normalised pressure differential (NPD) increases by 15% or normalised flux declines by 10% from baseline, a CIP is warranted. A standard CIP sequence for SWRO systems:
High pH clean (pH 11–12, sodium hydroxide + surfactant) – targets biofouling and organic deposits:
- Recirculate cleaning solution at 35–40°C for 30–60 minutes
- Soak for 1–8 hours
- Flush with RO permeate or low-SDI feedwater
Low pH clean (pH 2–3, citric acid or HCl) – targets scale and inorganic deposits:
- Recirculate cleaning solution at ambient temperature for 30–60 minutes
- Soak for 1–4 hours
- Flush and return to service
Membrane autopsy, physical dissection and laboratory analysis of a sacrificed element — is the most reliable diagnostic tool when conventional CIP fails to restore performance. Key tests include SEM/EDX analysis for elemental composition of deposits, microbial culture for biofouling identification, and TOC analysis for organic fouling characterisation.
Membrane Service Life
With proper pre-treatment and CIP protocols, SWRO membrane elements have a typical service life of 5–7 years. The International Desalination Association (IDA) recommends performance logging at minimum monthly intervals to detect fouling trends early and schedule CIP before irreversible compaction or chemical degradation occurs.
The Final Filtration
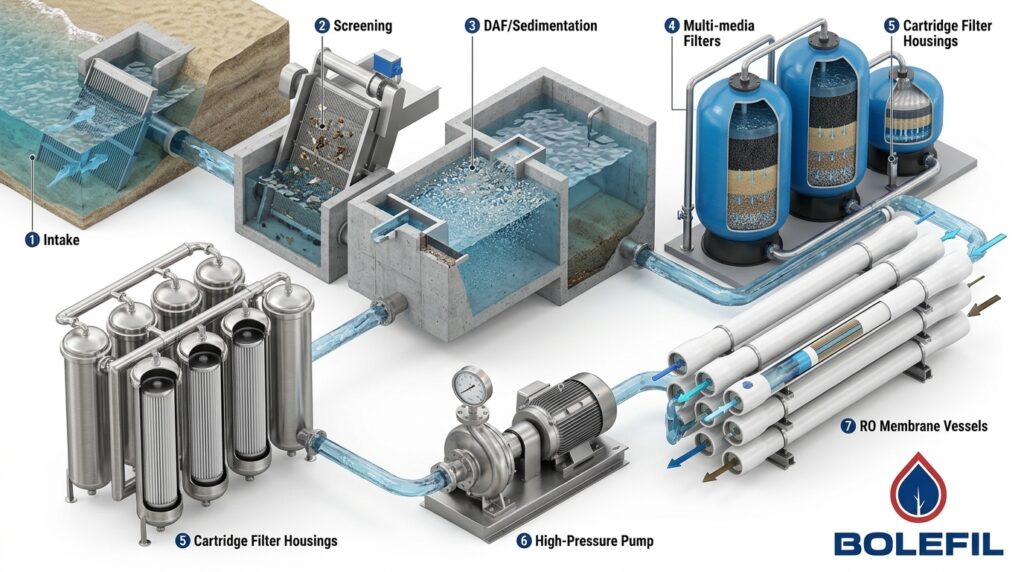
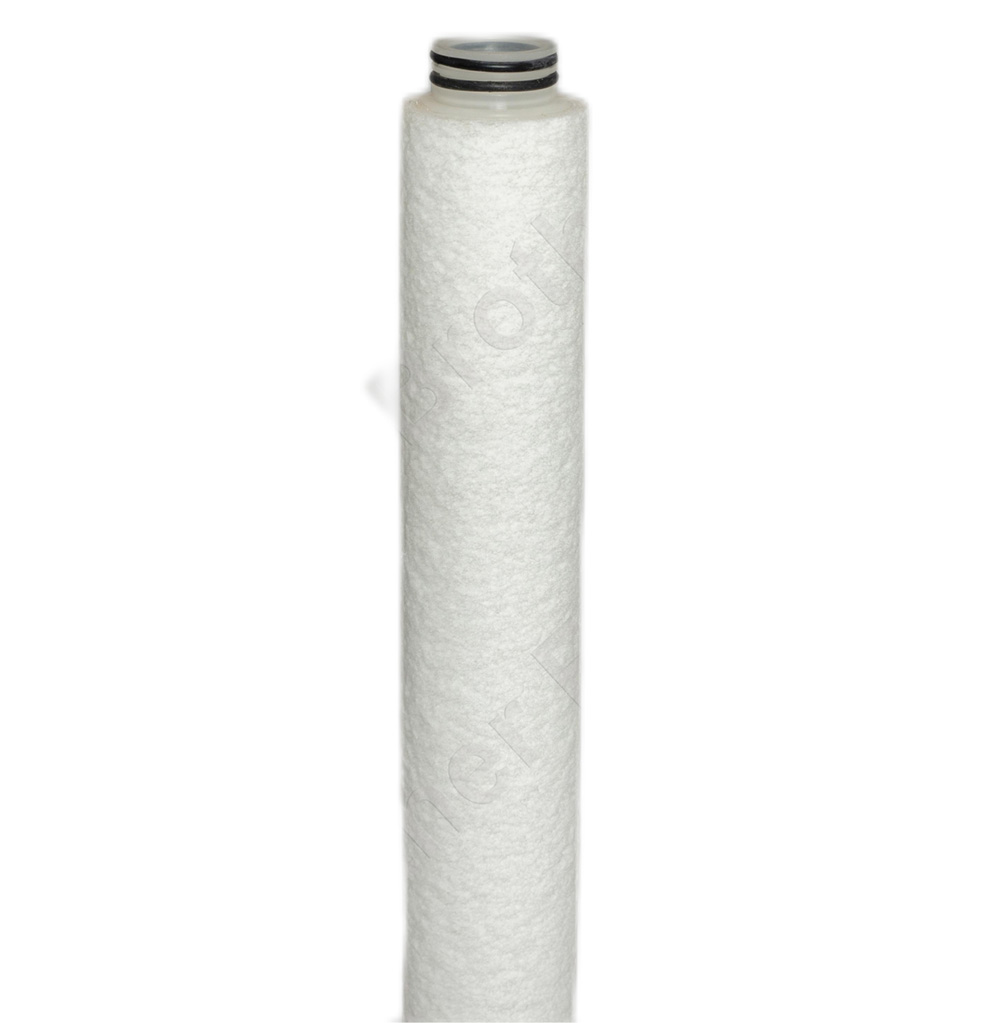
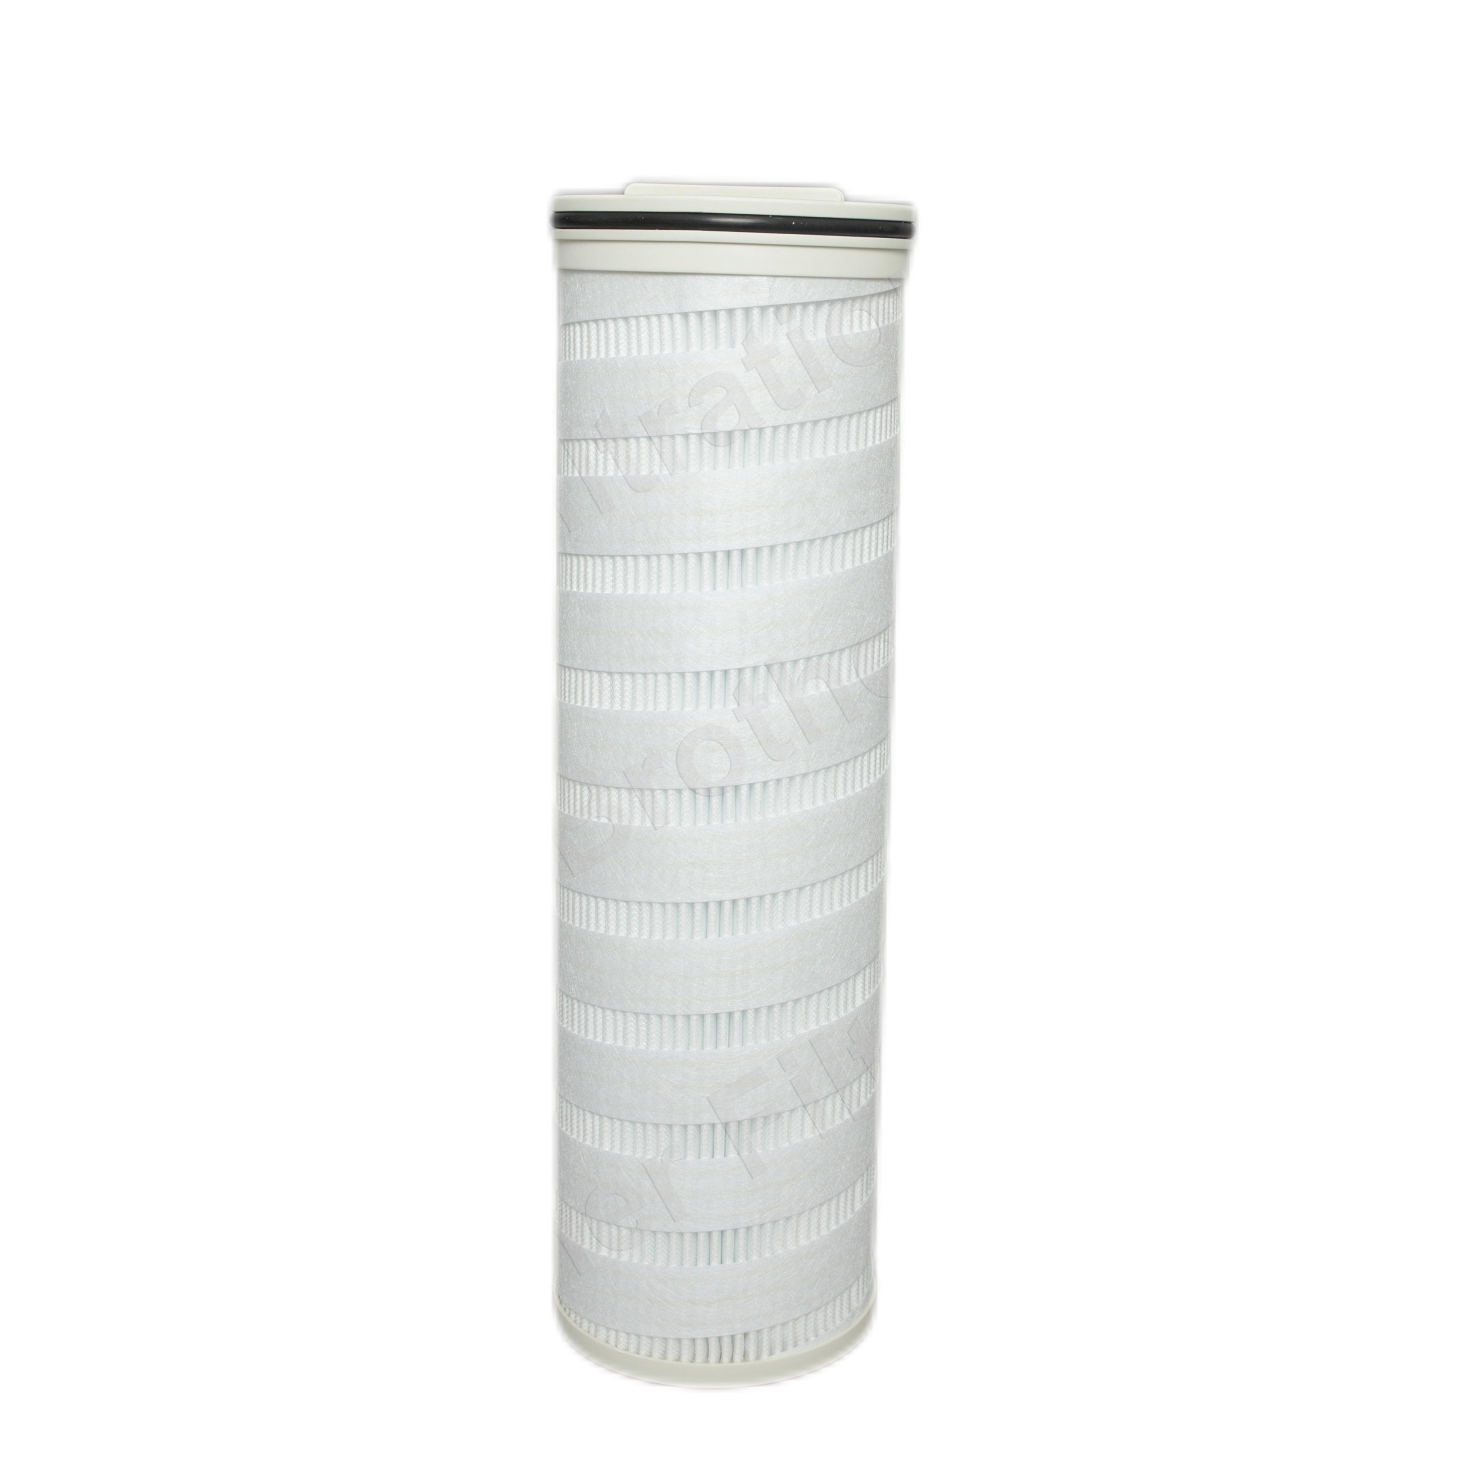
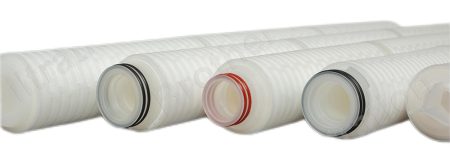
At the final filtration, we need to do further precise filtration to make the water drinkable, here the main filter cartridges we use are Polypropylene Pleated Filter and Polyethersulfone Membrane Pleated Filter.
The Polypropylene Pleated Filter is commonly used for final filtration. Its pleated design offers a larger surface area, allowing for more effective filtration and reducing the chance of clogging.
Additionally, Polyethersulfone (PES) Membrane Pleated Filters are known for their excellent performance in removing bacteria, viruses, and other microorganisms from the water.